This article builds on a series of previous discussions around building an agentic SOC solution, comparing agentic versus deterministic logic, and walking through an overview of Sentinel MCP. In this one, the focus shifts to hands-on evaluation.
The goal here is to take Microsoft Sentinel MCP and run it inside Visual Studio Code to see how it actually behaves in practice.
What makes this scenario distinct is how MCP is being used. This is not about writing Python or building an application that calls MCP. When you integrate MCP into VS Code, it extends the GitHub Copilot Chat experience so that you can interact with Sentinel data lake using natural language. In many cases, that also surfaces data from Defender XDR, although that may simply be a reflection of what is available through the data lake.
This article walks through setup, explores the two primary collections used for investigation, and shares insights from real testing. The goal is to clarify not just what MCP is capable of, but how it actually behaves when used interactively.
Important: Data Privacy Consideration
Before working through this example, it is important to call out a key consideration around data privacy.
Microsoft documentation for **Microsoft Sentinel MCP focuses on how to connect and use these tools, but it does not explicitly address the implications of using MCP with public LLMs. Based on practical evaluation, this is something worth considering carefully.
When using MCP through Visual Studio Code, GitHub Copilot Chat, or when connecting MCP to external tools such as ChatGPT or Claude, the model becomes the orchestrator of queries against your security data. Even though those queries run securely using your credentials and permissions, the responses are still processed by the model.
If that model is a public LLM, there is a potential risk that sensitive information could be exposed beyond your environment. For that reason, it is important to consider whether the model acting as the agent or orchestrator is public or private when working with production Sentinel data.
The approach described in this article is best suited for lab or testing environments to explore the capabilities of Sentinel MCP. It should not be considered a secure pattern for production use when paired with public LLMs.
Sentinel MCP Collections
Sentinel MCP is delivered as multiple collections, each exposed as its own MCP server. At the time of writing, there are three primary collections available:
- Data Exploration
- Triage
- Agent (Security Copilot agent creation and management)
We covered these at a higher level in the previous article, but here we focus on the first two.
Data Exploration and Triage are the collections used for investigation. The Agent collection is intentionally out of scope here, as it focuses on managing and deploying Security Copilot agents.
In addition to Sentinel MCP, I also added the Microsoft Learn MCP endpoint. It is not required, but it provides a way to ground responses in official documentation, which can help reduce guesswork when the agent needs to understand a feature or schema.
One thing that became clear during this process is that the MCP ecosystem is still early. Outside of Microsoft-provided endpoints, there are very few clearly defined third-party MCP options today. Most integrations still rely on APIs rather than MCP, which is worth keeping in mind when thinking about long-term architecture.
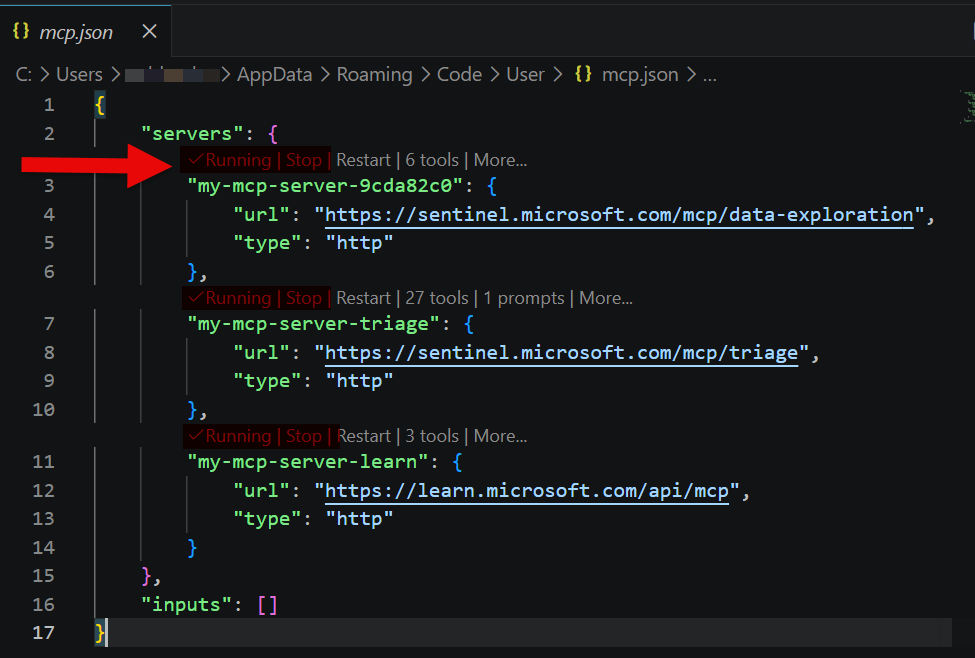
Getting It Running in VS Code
There are two straightforward ways to configure MCP in VS Code.
The first is to use the command palette. Press Ctrl + Shift + P, run MCP: Add Server, choose HTTP, and paste the endpoint (listed below). Repeat that process for each collection you want to use. This is the easiest approach and will automatically create and update the configuration file.
https://sentinel.microsoft.com/mcp/data-exploration
https://sentinel.microsoft.com/mcp/triage
https://learn.microsoft.com/api/mcp
The second option is to edit the configuration directly. MCP servers are defined in:
.vscode/mcp.json
If the file does not exist, you can create it manually, although it is usually simpler to let VS Code generate it using the Add Server command.
A working configuration looks like this:
{
  "servers": {
    "sentinel-data-exploration": {
      "type": "http",
      "url": "https://sentinel.microsoft.com/mcp/data-exploration"
    },
    "sentinel-triage": {
      "type": "http",
      "url": "https://sentinel.microsoft.com/mcp/triage"
    },
    "microsoft-learn": {
      "type": "http",
      "url": "https://learn.microsoft.com/api/mcp"
    }
  }
}
Once configured, VS Code displays a Start button above each server entry. Selecting Start initializes the connection and prompts for authentication when required. When active, the status changes to Running.
To validate the setup, open Copilot Chat in Agent mode and ask it to list available MCP tools. If tools are returned, the connection is active.
Once configured, your MCP connections become visible throughout VS Code. You will see them in the MCP configuration view, and additional Ctrl + Shift + P commands are available to list, start, and stop MCP connections.
Because these connections require authentication, they are not persistently active. After a period of time, the session will expire and the connection will stop running. When you return later, you will need to start it again, which will trigger reauthentication.
Note: It is possible to add endpoints to the JSON file that are not actually valid. VS Code will not flag them as errors, but they will not return tools or function correctly. Be cautious when sourcing endpoints from an LLM, as these can be hallucinated. If a server does not return tools, it is either invalid or not available in your environment.
Data Exploration
We described the data exploration collection at a high level in the previous article. What changes here is that we now have the ability to interact with it directly and observe its behavior.
The collection contains the following tools:
| Tool | Description |
|---|---|
| list workspaces | Returns available Sentinel workspaces |
| search tables | Retrieves table schema information |
| query lake | Executes KQL queries against the data lake |
| analyze user | Performs user-based analysis |
| analyze URL | Performs URL-based analysis |
| get entity analysis results | Returns structured entity insights |
These tools are designed to work together. The search tables tool provides schema grounding, which improves query accuracy. The query lake tool is the primary execution path for KQL.
A key observation from testing is how the entity analysis tools behave. The user and URL analysis tools require a start and end time, and that range cannot exceed seven days. This constraint is not clearly documented but is consistently enforced. The seven-day window can be anywhere in the dataset; it does not have to be recent.
Once identified, this becomes something worth including in a system prompt so the agent avoids unnecessary retries.
It is also worth noting what is not present. There are currently no dedicated tools for IP-based analysis or other entity types in this collection.
Triage
The triage collection contains approximately 27 tools focused on investigation across incidents, alerts, and entities.
While not explicitly documented, the triage collection does appear to use the Defender Advanced Hunting API to gather information rather than querying the data lake. This likely implies that you are not incurring a data lake query charge. The documentation also notes that entity analysis requests, even though powered by Microsoft Security Copilot, do not incur additional cost.
At a high level, it enables you to:
- Review incidents and alerts
- Run advanced hunting-style queries
- Investigate files, IPs, users, and machines
- Access vulnerability and exposure data
- Review indicators
- Track investigations and remediation
Much of this mirrors what you would see in the Defender portal, especially when working through incident views and user or device profiles.
| Tool | Description |
|---|---|
| ListIncidents | Retrieve incidents |
| GetIncidentById | Get incident details |
| ListAlerts | Retrieve alerts |
| GetAlertByID | Get alert details |
| FetchAdvancedHuntingTablesOverview | List hunting tables |
| FetchAdvancedHuntingTablesDetailedSchema | Get hunting schema |
| RunAdvancedHuntingQuery | Execute hunting queries |
| GetDefenderFileInfo | File details |
| GetDefenderFileStatistics | File prevalence |
| GetDefenderFileAlerts | Alerts tied to file |
| GetDefenderFileRelatedMachines | Machines tied to file |
| GetDefenderIpAlerts | Alerts tied to IP |
| GetDefenderIpStatistics | IP statistics |
| GetDefenderMachine | Machine details |
| GetDefenderMachineAlerts | Machine alerts |
| GetDefenderMachineLoggedOnUsers | Logged-on users |
| GetDefenderMachineVulnerabilities | Vulnerabilities |
| FindDefenderMachineByIp | Machine lookup by IP |
| ListUserRelatedAlerts | Alerts tied to user |
| ListUserRelatedMachines | Machines tied to user |
| ListDefenderMachinesByVulnerability | Machines by vulnerability |
| ListDefenderVulnerabilitiesBySoftware | Vulnerabilities by software |
| ListDefenderIndicators | IOC indicators |
| ListDefenderInvestigations | Investigations |
| GetDefenderInvestigation | Investigation details |
| ListDefenderRemediationActivities | Remediation actions |
| GetDefenderRemediationActivity | Remediation details |
These tools are read-only. They provide visibility into incidents, entities, and exposure, but they do not allow you to modify incidents or trigger response actions.
Observations from Real Testing
The first thing that stands out is performance. When the agent needs to work through multiple tools, it takes time. It must decide which tool to use, execute it, interpret the result, and sometimes retry. This is very different from a standard chat interaction where the model is simply generating text.
Prompt quality has a direct impact on performance. A vague question leads to more exploration and retries. A well-formed question leads to faster and more accurate results.
You also begin to see patterns in how the agent behaves. If a tool fails, it will often retry with slight variations. Within a session, it may adjust its approach. Across sessions, it will typically repeat the same patterns.
Another factor is the number of tools. Larger toolsets introduce more decision-making overhead. This can slow responses and increase the likelihood of selecting suboptimal paths.
Controlling the Agent (and When to Stop)
Rather than trying to fully script the agent’s behavior, the system prompt should focus on the gaps, specifically constraints and behaviors that are not obvious but are required for the MCP tools to work efficiently.
You can control the agent to a reasonable degree by providing targeted guidance such as:
- Required input constraints for specific tools
- Known failure patterns
- Preferred recovery behavior
At the same time, there is a practical limit. If the system prompt becomes overly complex and starts to resemble a step-by-step procedure, it is a signal that the problem may be better suited for a deterministic workflow.
There is also the question of memory. Agents in this context operate with session-based memory. They can adapt within a session, but they do not retain those lessons over time. When a new session starts, the agent effectively resets.
That means inefficiencies can repeat. If an agent has many tools to choose from, it may rediscover the same optimal path repeatedly rather than remembering it.
This points to a more advanced design consideration. A strong system prompt combined with some form of long-term memory would allow an agent to improve over time. Without that, the agent remains flexible but does not become more efficient.
Sample System Prompt for Sentinel MCP
Below is a refined system prompt that focuses only on non-obvious constraints and observed behaviors:
You are an analyst assistant using Microsoft Sentinel MCP tools.Data Exploration:
- When using "analyze user" or "analyze URL", you must always include a start and end time.
- The time range must not exceed 7 days.
- If a broader time range is required, break the request into multiple 7-day queries.- If a query fails due to missing tables or columns, use "search tables" to retrieve schema before retrying.Triage:
- Use triage tools for investigation of incidents, alerts, users, machines, files, and IPs.
- These tools provide read-only access to Defender and related data.General:
- If a tool fails twice, do not continue retrying the same approach. Adjust the method or select a different tool.Output:
- Summarize findings clearly, highlighting key entities, risks, and relevant relationships.
This type of prompt avoids restating obvious behavior and instead focuses on tool-specific constraints and failure patterns that improve efficiency.
Where VS Code Fits
Using VS Code with Sentinel MCP is best viewed as a workbench.
It is a simple way to:
- Connect to MCP
- Test prompts
- Explore tool behavior
- Understand how the agent operates
That insight is what makes it valuable.
For a conversational interface, Copilot Studio is a more natural fit. For automation and repeatable workflows, Foundry or a deterministic approach is more appropriate.
Securing Model Usage in VS Code
When working with Sentinel MCP and external models in Visual Studio Code, it is important to consider how model access is controlled.
In enterprise environments, it is possible to restrict which models and providers are allowed using organizational controls such as GitHub Copilot policies, Entra-based access, and network restrictions. This helps ensure that only approved models are used when interacting with sensitive data like Microsoft Sentinel.
However, there is still an inherent gap. VS Code can be used on unmanaged or personal devices, where those controls may not apply. At the same time, connecting a custom model, such as one hosted in Foundry, requires additional setup, while the default Copilot experience is immediately available. As a result, users may default to the easiest option, which can involve public LLMs.
Even though it appears that controls can be put in place, there does not yet seem to be a complete or enforceable framework that guarantees public LLMs are not used when interacting with Sentinel MCP. Monitoring for this scenario is also not straightforward, as it is not immediately clear how an organization would reliably determine whether queries are being orchestrated by a public versus private model.
In some environments, it may be necessary to restrict or disable Sentinel MCP access from VS Code entirely to maintain control over how sensitive data is processed.
Closing Thoughts
Running Sentinel MCP inside VS Code provides a clear view into how these tools behave in practice. It highlights both the strengths and the limitations of agent-driven workflows.
It is easy to get running, easy to experiment with, and very effective for understanding how MCP works under the hood.
At the same time, it is important to reiterate that connecting Microsoft Sentinel to Visual Studio Code will, in many cases, involve interacting with a public LLM unless you take intentional steps to control the model being used. That introduces a potential risk of exposing sensitive data, as the model is responsible for processing the results returned from your environment.
More importantly, this exercise reinforces that MCP is a capability layer, not a complete solution. How you apply it, whether through agents, deterministic workflows, or a hybrid approach, is where the real design decisions come into play.
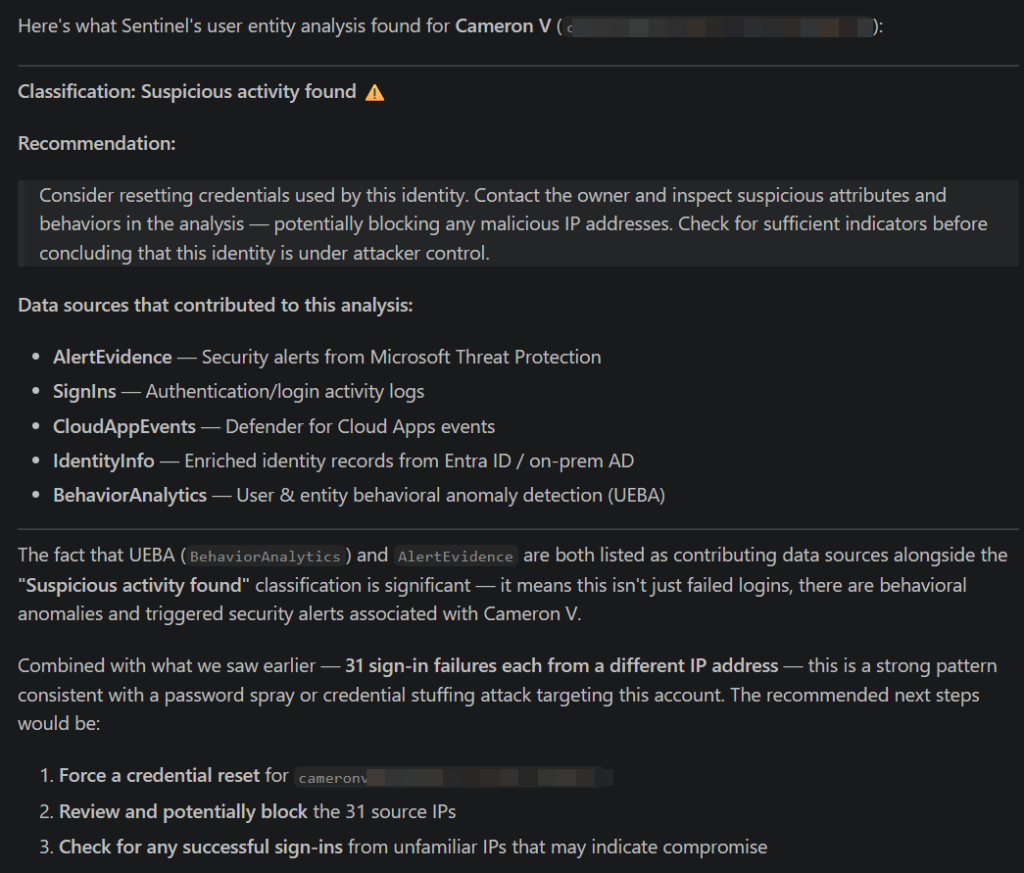
Bonus Content
Here are some screen shots of query reponses:
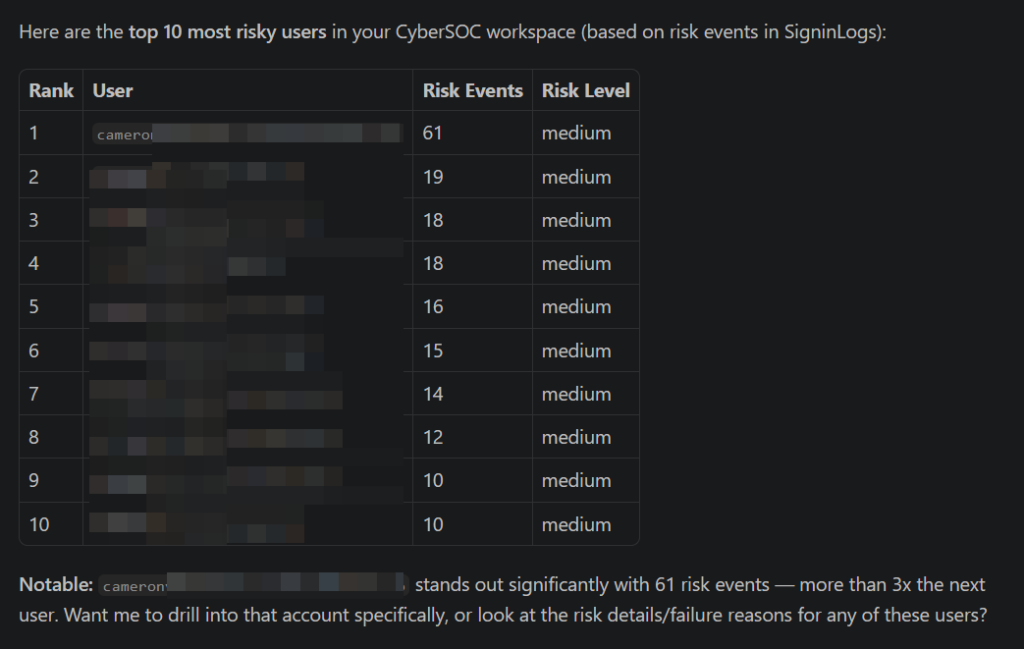
Give me a list of the top 10 most risky users:
Using the best entity analysis tool, evaluate my most risky user:
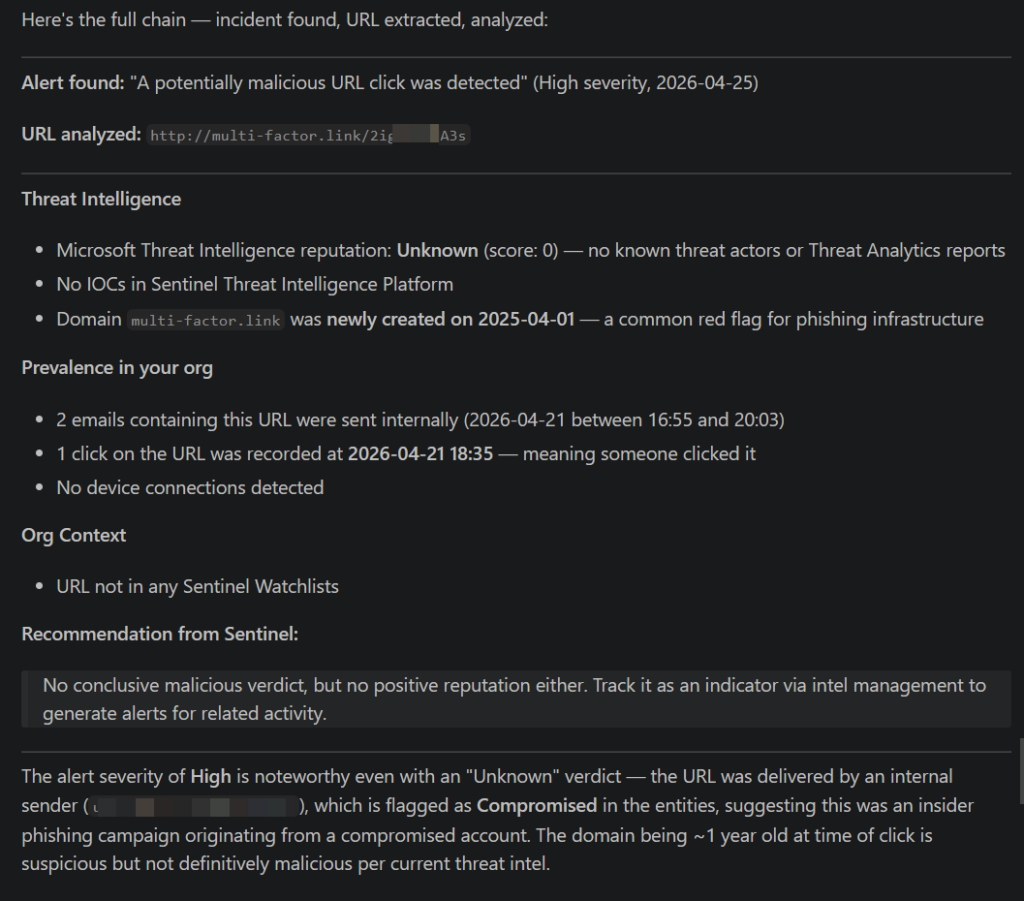
Find a recent incident with a URL entity and run entity analysis: